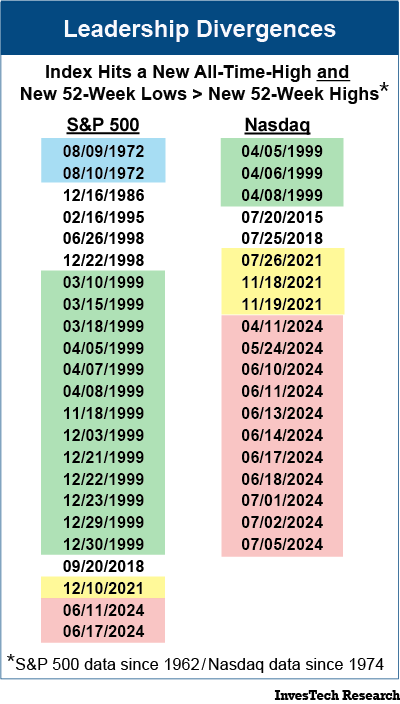
This past month has seen several highly unusual leadership and breadth divergences where seemingly positive developments have had questionable technicals under the hood. Even as we saw some resolution of these anomalies this week, yet another “first-ever” technical divergence emerged — this time looking at actual index performance.
Earlier this month we published a Market Insight on unprecedented leadership divergences in the Nasdaq. When diving deeper into leadership divergences in the Nasdaq, and adding in the S&P 500, a concerning pattern begins to appear.

It is extremely unusual for an index to reach a new all-time-high when downside leadership surpasses upside leadership. This has only occurred during a handful of periods.
- There was a leadership divergence in the S&P 500 lasting two days in 1972 (blue in table) before the devastating bear market of 1973-74 with a loss of -48.2%.
- Then, there were 13 divergences in the S&P 500 in the 12 months leading up to the peak of the Tech Bubble and three divergences in the Nasdaq over this same period (green in table). This preceded a bear market with losses of -49.1% in the S&P 500 and -77.9% in the Nasdaq.
- More recently there were similar divergences in the S&P 500 and the Nasdaq leading into the January 2022 peak (yellow in table) when the market lost just over -25%.
- Now, in the past three months there have been two of these divergences in the S&P 500 and 11 in the Nasdaq (red in table).
The technical divergences today spread beyond those in leadership. Shifting our review to recent performance, we see another, even rarer, divergence. The Dow Jones Industrial Average (DJIA) was the only major US index to close up on Wednesday of this week (July 17th, 2024) with a +0.59% daily change, while the Nasdaq fell -2.77%, the S&P fell -1.39%, and the Russell 2000 fell -1.06%. We have never seen such a severe contrast in the daily performance of these Indexes compared to the Dow.
In fact, the only way we find anything that even comes close to the severity of the divergence on July 17th is looking at days where the DJIA has closed up over +0.5%, and the Nasdaq, S&P 500, and Russell 2000 closed down over -0.5%. In the history of these Indexes, that has only occurred two times before this week: on March 20, 2000, and April 10, 2000. Both were within a month of the peak of the Tech Bubble.
The obvious historical question is whether this might reflect a flight to safety into the blue-chip stocks of the Dow.
To expand on this unsettling similarity, the year before the peak in the Tech Bubble held the record for lowest percentage of stocks in the S&P outperforming the index… until this year. Read more about this fascinating parallel on page 8 of the July issue of InvesTech Research published today.
Does this mean we are in for another Tech Bubble style washout? It’s impossible to know for certain. No two economic cycles are identical, and we are not in the business of timing the market. What this does mean for us is that we’re going to proceed with caution and continue to evaluate the weight of the evidence, looking at technical, macroeconomic, and monetary indicators as we navigate our way through this truly unusual market environment.
